Your salon breaks even when monthly revenue covers every fixed cost, calculated as: Services/month = Monthly fixed costs ÷ (Average ticket × gross margin per service). A revenue-based version works too: Fixed costs ÷ contribution margin percentage. Pull your last three months of fixed costs and your average ticket right now, and you can run this check in under ten minutes.
TL;DR:
- Salon break-even depends heavily on fixed costs, owner salary, and the average ticket price, with a typical service margin around $57.
- Increasing service prices by 5% to 8% or boosting retail attach rates by 5% can significantly lower the number of services needed to break even.
- Seasonality can cause large fluctuations; calculating a rolling 12-month average provides a more accurate target than relying on a single peak or slow month.
- Rent and occupancy costs, especially percentage-based leases, must be recalculated regularly to reflect changes and accurately determine break-even points.
- Real-time tools like LumariPRO streamline tracking key metrics and help owners adjust dynamically, preventing slipping into unprofitability.
Table of Contents
- What Is Salon Financial Analysis and the Break-Even Formula?
- How Do You Calculate Your Salon’s Break-Even Point?
- What Salon Benchmarks Show a Healthy Break-Even Point?
- Which Levers Actually Lower Your Break-Even Point?
- Worked Example: Running a Sample Salon’s Numbers
- How Does Seasonality Affect Your Break-Even Analysis?
- How Do Rent and Occupancy Costs Factor Into Break-Even?
- Author Perspective: Why Owner Pay Changes Everything
- How LumariPRO Helps You Track Break-Even and Profitability
- Sources
What Is Salon Financial Analysis and the Break-Even Formula?
Salon break-even analysis has two working formulas, and which one you reach for depends on how your books are organized.
The unit formula answers “how many services do I need to sell?”: divide monthly fixed costs by the gross margin per service (average ticket times your margin percentage). The revenue formula answers “how much total revenue do I need?”: divide fixed costs by your contribution margin percentage. Both land on the same dollar figure. Use the unit version when you think in appointments; use the revenue version when you’re working straight off a profit and loss statement.
Fixed costs don’t move with client volume: rent, utilities, software subscriptions, insurance, and a market-rate replacement salary for yourself. Variable costs scale with each service: product cost of goods sold, commission or booth-related payouts, and card processing fees. A salon paying $28 in product and commission on a $90 color service has a $62 gross margin on that ticket alone.
Before you touch a break-even calculator, gather these five inputs:
- Total monthly fixed costs, including your own replacement salary
- Average ticket price across all services (not just your top seller)
- Variable cost per service (product plus commission)
- Number of trading days per month
- Number of active chairs or suites
How Do You Calculate Your Salon’s Break-Even Point?
Grab your P&L and a calculator, and work through these three steps in order.
- Total your monthly fixed costs. Pull rent, utilities, software, insurance, and marketing straight from your P&L’s operating expense section. Then add a line most owners skip entirely: your own replacement salary. Without it, you’re measuring whether the business survives, not whether it pays you.
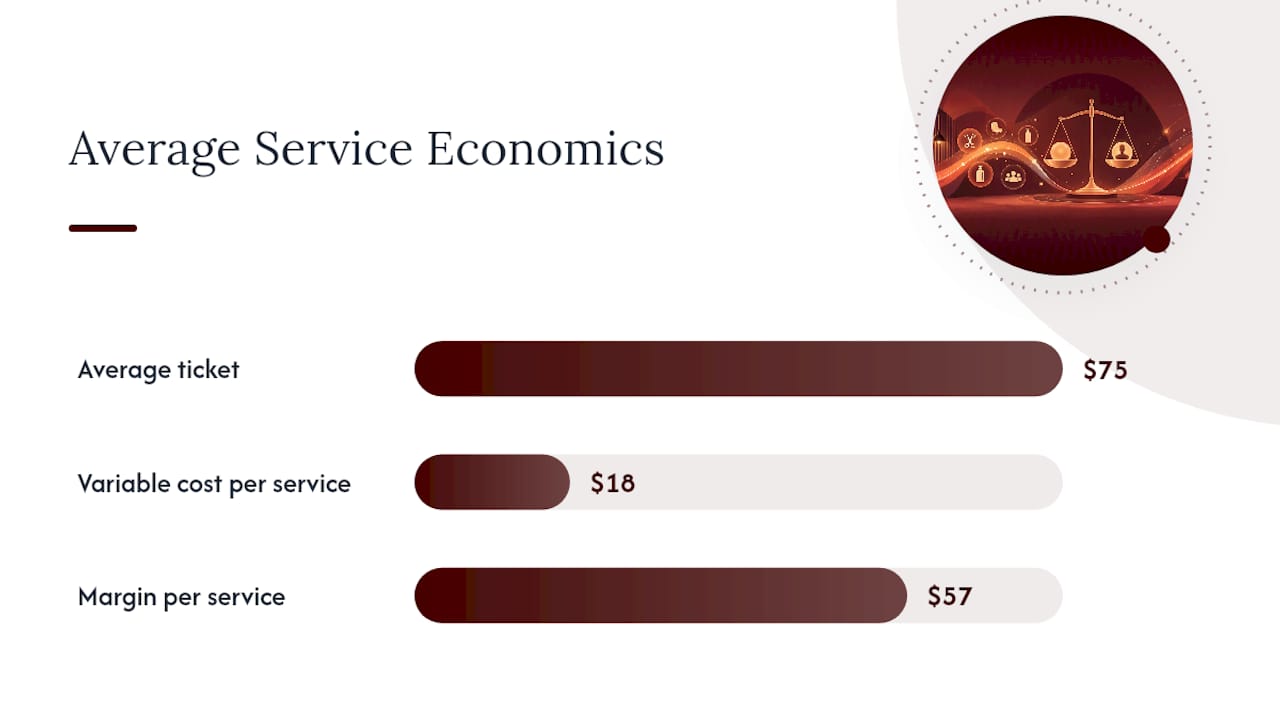
- Find your gross margin per service. Divide total service revenue by total services sold to get your average ticket. Subtract the average variable cost per service (product plus commission) to get your margin per service. If your average ticket is $75 and variable cost per service runs $18, your margin is $57.
- Convert to a daily target. Divide monthly fixed costs by that margin to get services/month, then divide by your trading days to get services/day. Split that across your active chairs to see what each stylist or suite needs to hit.
If your books are messy, smoothing your numbers over a rolling 12 months prevents one slow month or one holiday spike from skewing your target. When a line item is missing, estimate conservatively (round costs up, round margin down) rather than skip it.
Pro Tip: Run this calculation quarterly, not once a year. Rent increases, commission structure changes, and a new product line all shift your break-even, sometimes by a meaningful margin.
What Salon Benchmarks Show a Healthy Break-Even Point?
A break-even number in isolation tells you little. Compare it against industry ranges to know if your salon is structurally healthy or just scraping by.
Net profit margins for salons typically run between 8.2% and 17%, with wide variation by business model, booth rental, commission, or hybrid. Gross margins usually sit at typical industry levels. Labor and rent combined often consume a substantial portion of total revenue, which is the single biggest reason two salons with identical square footage can have wildly different break-even points.
Beyond the P&L, track these operational signals:
- Chair utilization: a healthy target sits at 70% to 85%; below 70% usually points to a scheduling problem, not a demand problem
- Average ticket: trending flat for over a year usually means you’re overdue for a price review
- Labor or commission percentage: creeping past 55% in a commission model tends to compress margin fast
- Retail attach rate: 8% to 15% of service revenue is typical; anything lower is money left on the table
If chair utilization is the weak link, fix scheduling gaps and no-show policy before you touch pricing. If labor percentage is the problem, that’s a staffing structure conversation, not a marketing one.
Which Levers Actually Lower Your Break-Even Point?
Not every fix carries equal weight. Some levers move your break-even point overnight; others take months to show up.
- Pricing cadence: review prices annually at minimum. A 5% to 8% increase on services, paired with a short heads-up to regulars, rarely causes mass cancellations but adds real margin per ticket.
- Scheduling and no-shows: requiring deposits and automating appointment reminders recovers hours that would otherwise sit empty on the book.
- Retail attach and service mix: pushing retail attach up a few points or steering more clients toward higher-margin color and treatment services moves your margin without adding a single new client.
- Labor structure: commission tiers tied to productivity, or a hybrid booth/commission model, keep payroll from creeping past that 55% danger zone.
- Tech and fees: POS integrations and QuickBooks syncing cut the hours spent reconciling by hand and catch merchant fee creep before it eats a full percentage point of margin.
Pro Tip: Retail and deposits are the cheapest wins on this list. Both require zero new marketing spend and usually show up in next month’s numbers.
Worked Example: Running a Sample Salon’s Numbers
Picture a three-chair salon with $13,000 in monthly fixed costs, including a $4,500 owner replacement salary.
- Baseline: $13,000 ÷ $52 = 250 services/month, or roughly 83 per chair across 25 trading days, about 3.3 services per chair per day.
- Scenario A, ticket up 10%: average ticket rises to $71.50, margin per service to $57.20. Break-even drops to 227 services/month, a meaningful cushion without adding a single client.
- Scenario B, retail attach up 5%: if that translates to roughly $3 in added margin per ticket, gross margin per service climbs to $55. Break-even falls to 236 services/month.
| Scenario | Avg. Margin per Service | Services/Month to Break Even |
|---|---|---|
| Baseline | $57.00 | 250 |
| +10% ticket price | $57.20 | 227 |
| +5% retail attach | $55 | 236 |
The ticket-price scenario produced the biggest single swing, a 23-service drop, because pricing touches every transaction at once, while retail attach depends on how consistently the team actually offers the add-on.
How Does Seasonality Affect Your Break-Even Analysis?
A break-even number calculated from your busiest month lies to you the other eleven months of the year. Salons see real swings tied to holidays, wedding season, back-to-school color appointments, and slow stretches in late summer or right after the December rush.
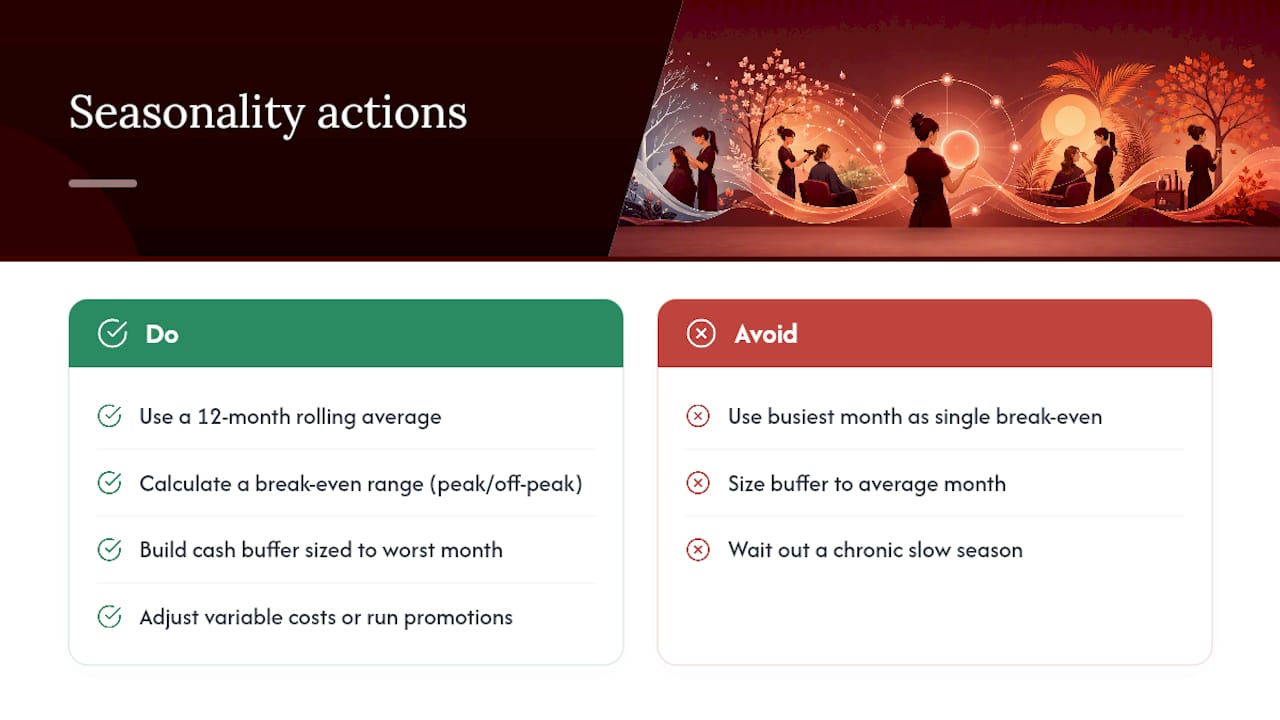
The fix isn’t a single break-even number. It’s a break-even range calculated against a rolling average, ideally 12 months of data, so one strong or weak month doesn’t distort your target. If you only have six months of history, use what you have but flag it as provisional and revisit once you’ve got a full year.
Build a cash buffer sized to your worst historical month, not your average month. If January revenue typically runs 20% below your yearly average, your fixed costs don’t shrink to match. That gap has to come from somewhere: a cash reserve built during peak months, a short-term adjustment to variable costs (temporarily lighter retail ordering, for instance), or a seasonal promotion designed specifically to fill the trough.
Some owners split their break-even calculation into a “peak” and “off-peak” version, recalculating average ticket and services/day for each period separately. That’s more work upfront, but it gives you a realistic daily target instead of one number that’s wrong eight months out of twelve. If your slow season consistently misses break-even, that’s the signal to negotiate rent relief, add a seasonal service, or trim staffing hours rather than wait it out.
How Do Rent and Occupancy Costs Factor Into Break-Even?
Rent is usually the single largest fixed cost on a salon P&L, and it’s rarely as flat as owners assume. Percentage-rent leases, common in retail centers and some suite arrangements, tie part of your rent to a share of revenue once you cross a sales threshold. If your lease has that clause, your break-even calculation needs a second tier: the fixed base rent up to the threshold, then a variable rent layer above it.
Common area maintenance fees, property tax pass-throughs, and utility escalations also creep upward year over year, often without a corresponding line-item alert. Build a habit of re-pulling your full occupancy cost, not just base rent, every time you recalculate break-even, ideally quarterly.
If you’re a suite renter rather than a full-salon lessee, your “rent” line is simpler but not immune to change. Suite fees can rise annually, and some contracts bundle in utilities or WiFi that get repriced separately. Treat any bundled fee increase the same way you’d treat a rent hike: recalculate break-even the same month the new rate takes effect, not at your next annual review.
One practical move: if you’re evaluating a new location or a suite upgrade, run break-even math on the proposed occupancy cost before you sign, not after.
Author Perspective: Why Owner Pay Changes Everything
Most break-even conversations skip the one line that actually determines if the business is worth running: owner replacement salary. Treat it as a real fixed cost, then run a daily close-out asking one question: did today’s revenue cover our fixed-cost slice? That single habit, more than any spreadsheet, keeps small owners and suite renters honest about whether the math is actually working.
— Oliver
How LumariPRO Helps You Track Break-Even and Profitability
Lumaripro turns break-even math from a once-a-year spreadsheet chore into something you check the way you’d check your booking calendar. The platform connects to your POS and QuickBooks, so fixed costs, average ticket, and margin per service update automatically instead of waiting for you to reconcile statements at month’s end.

You get a real-time financial dashboard that surfaces chair utilization, labor percentage, and retail attach against the benchmarks covered above, plus a built-in ROI and break-even calculator that runs the same sensitivity scenarios shown in the worked example, ticket price, retail attach, owner pay, without a manual spreadsheet. Pair that with the coaching and playbooks available through the platform overview, and you’ve got a way to catch a slipping utilization number before it becomes a slipping quarter. Run your own numbers through the calculator this week and see where your break-even actually sits.
Sources
- 2026 Salon Profitability Data: The Truth Behind the Numbers
- Break-Even Calculator for Salon – Free Calculator | KnowYourNut
- Time hair salon owners spend on accounting (CSI Accounting blog)
Recommended