Salon inventory turnover measures how many times you sell through and replace your stock in a given period, calculated as cost of goods sold (COGS) divided by average inventory value. A healthy retail turnover for most salons lands around 4 to 6 times per year; anything lower usually means cash tied up in shelf product, and anything much higher can mean you’re stocking out of your best sellers.
Here’s the quick math you’ll use throughout this guide:
- Formula: Inventory turnover = COGS ÷ Average inventory
- Benchmark: Retail typically turns 4 to 6 times a year; backbar usage often needs separate tracking.
- Days on hand: 365 ÷ turnover rate tells you how long product sits before it moves.
Grab your last 12 months of purchase invoices and your beginning and ending inventory counts. The worked example below shows exactly how to plug those numbers in.
| Point | Details |
|---|---|
| Formula | COGS ÷ average inventory gives you a turnover ratio you can benchmark against industry norms. |
| Track separately | Retail and backbar have different margins and shrink patterns, so blend them and you lose the signal. |
| Convert to days | 365 divided by your turnover rate tells you how many days product sits before selling. |
Key Takeaways
Salon inventory turnover, calculated as COGS divided by average inventory, reveals cash flow health and waste risk faster than any physical stock count alone.
| Point | Details |
|---|---|
| Use the formula correctly | Divide COGS by average inventory, calculated separately for retail and backbar. |
| Target 4 to 6 times a year | This range balances cash flow against the risk of stockouts on best sellers. |
| Count on a fixed cadence | Weekly spot checks, monthly full counts, and quarterly audits catch problems early. |
| Fix the biggest waste source | Portion control on backbar color and developer prevents the most common invisible loss. |
| Automate the tracking | Lumaripro connects to POS and QuickBooks to surface turnover and days on hand automatically. |
Table of Contents
- What Salon Inventory Turnover Actually Measures
- Retail Stock vs. Backbar Supply: Why the Split Matters
- How to Calculate Salon Inventory Turnover Step by Step
- What Counts as a Healthy Turnover Rate
- The Salon Playbook for Improving Turnover
- Software That Actually Helps You Track Turnover
- How Often to Check Your Numbers
- Mistakes That Distort Your Turnover Number
- A Real Turnover Turnaround
- A Practitioner’s Note on Realistic Expectations
- Let a Dashboard Do the Counting for You
- Sources
What Salon Inventory Turnover Actually Measures
Inventory turnover tells you how efficiently your money moves. A retail shelf that turns six times a year means each product cycles out roughly every two months; a shelf that turns twice means product sits for six months before it sells, tying up cash you could have spent on new color lines or marketing.
Beauty product has a shelf life. Color developer degrades, retail serums oxidize, and expired backbar product gets tossed. Slow turnover isn’t just a cash-flow drag. It’s the direct cause of waste you can see in your trash can every month.
Product cost as a share of revenue is one of the clearest health checks in the business, and industry analysis puts typical salon product cost somewhere between 8% and 12% of revenue. If your number runs higher than that, slow turnover is often the reason. Cash sits in bottles instead of moving through your register.
A few things turnover reveals that a simple stock count never will:
- Whether you’re overbuying based on gut feel instead of actual usage
- Whether retail displays are converting browsers into buyers
- Whether backbar product is being portioned correctly or poured with a heavy hand
- Whether you have dead stock quietly expiring in the back room
Retail Stock vs. Backbar Supply: Why the Split Matters
Retail inventory is anything you sell directly to a client, shampoo, styling product, skincare, sitting on a shelf with a price tag. Backbar inventory is what you use up during services: color, developer, wax, peels, the stuff that never leaves the building in its original container.
Salon-specific guidance from the Professional Beauty Association recommends tracking these two categories separately, and the reason is simple math: retail margins and backbar consumption behave nothing alike. Retail turns based on client purchase behavior. Backbar turns based on how many services you booked and how much product each one used.
Blend the two into one turnover number and you lose the ability to diagnose either problem. A salon with strong retail sales but sloppy color portioning will show a deceptively average combined number, masking real backbar waste.
| Category | Recording Rule |
|---|---|
| Retail | Counted at cost, COGS recognized at point of sale |
| Backbar | Counted at cost, COGS recognized as product is used in service |
How to Calculate Salon Inventory Turnover Step by Step
You need three numbers for each category (retail and backbar, calculated separately): COGS for the period, beginning inventory value, and ending inventory value. The IRS accounting rules require you to pick a consistent valuation method, usually cost, and stick with it so your numbers stay comparable month to month.
Step 1: Calculate COGS. For retail, this is what you paid for the product you actually sold, not what you charged clients. For backbar, it’s the wholesale cost of product used in services during the period, which you’ll estimate from purchase records minus what’s left on the shelf.
Step 2: Calculate average inventory. Add your beginning inventory value and ending inventory value, then divide by two.
Step 3: Divide COGS by average inventory. That ratio is your turnover rate for the period.
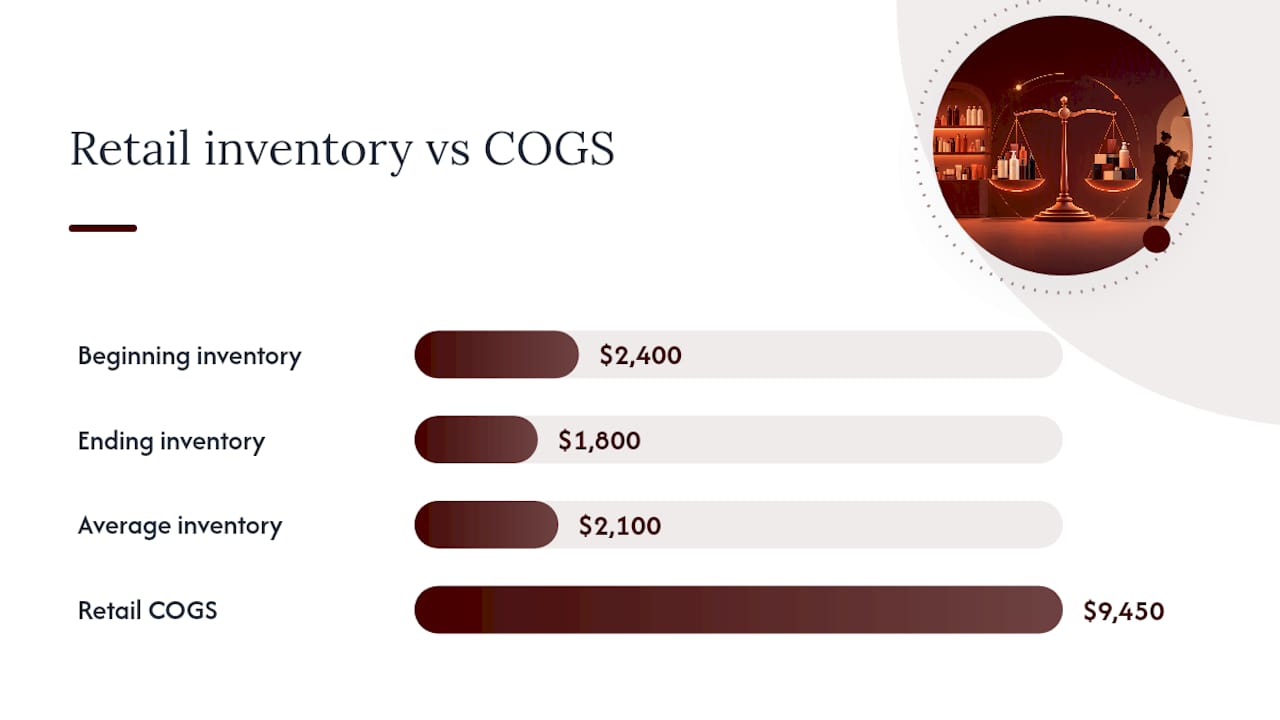
Here’s a worked example using a single-chair suite renter’s retail numbers for one year:
- Beginning retail inventory: $2,400
- Ending retail inventory: $1,800
- Retail COGS for the year: $9,450
Average inventory = ($2,400 + $1,800) ÷ 2 = $2,100
Turnover = $9,450 ÷ $2,100 = 4.5 times per year
Convert that to days on hand: 365 ÷ 4.5 = 81 days. Product sits on this shelf for about 81 days on average before it sells, which lands comfortably inside the healthy 4 to 6 range for retail turnover.
Pro Tip: Run this same three-step calculation separately for backbar. If your backbar “turnover” looks unusually high, check whether you’re actually tracking usage or just guessing at consumption from purchase totals. Guessed numbers always look better than real ones.
If you’re building this in a spreadsheet, set up these columns: Month, Beginning Inventory ($), Purchases ($), Ending Inventory ($), COGS (Beginning + Purchases − Ending), Average Inventory, Turnover Rate, Days on Hand. The COGS formula is simply beginning inventory plus purchases minus ending inventory, and your turnover cell divides COGS by average inventory automatically once those feed in.
What Counts as a Healthy Turnover Rate
A retail turnover rate of 4 to 6 times per year is the widely cited target, and it holds up because it balances two competing risks. Turn faster than that and you’ll likely run into stockouts on your best sellers. Turn slower and cash sits idle while product ages toward its expiration date.
Backbar turnover tends to run higher because service consumables move constantly, though most salons find it more useful to track backbar in cost percentage of revenue rather than a strict turnover ratio, since usage varies so much by service mix.
Here’s how to read your number once you calculate it:
- Below 4×: You’re likely overstocking. Cut order quantities and tighten your reorder points.
- 4× to 6×: You’re in a healthy range. Keep doing what you’re doing and recheck quarterly.
- Above 6× to 8×: Watch for stockouts on popular items; you may be underbuying.
- Above 8×: This usually signals chronic understocking, not efficiency, and it’s costing you retail sales you never rang up.
A turnover number without context is just a ratio. The direction it’s moving month over month tells you more than the number itself.
The Salon Playbook for Improving Turnover
Fixing turnover isn’t one big project. It’s a handful of small habits repeated on a schedule. Here’s the cadence that works for most independent salons and suite operations:
- Weekly: Spot check high-velocity retail items and backbar staples like color and developer.
- Monthly: Do a full physical count of every retail and backbar SKU.
- Quarterly: Run a deeper audit comparing purchase records against actual usage to catch shrinkage.
Beyond the counting schedule, a handful of specific tactics move the needle fastest:
ABC analysis. Rank your products by revenue contribution. Your top 20% of SKUs, the “A” items, probably drive 70 to 80% of sales. Watch those obsessively and let the “C” items get looser attention.
Par-level ordering. Set a minimum and maximum quantity for every product. Order up to the max only when you hit the minimum, never before, and never “just in case.”
FIFO rotation. First in, first out. New stock goes behind old stock on the shelf and in the back room, every single time, so nothing expires while a newer bottle sells first.
Portion control on backbar. Give every stylist a measuring guide for color and developer ratios. Unmeasured pours are the single biggest source of invisible backbar waste, and it’s rarely intentional. It’s just habit.

Shrink and expiry tracking. Log anything that gets tossed, damaged, or goes missing. If you can’t explain a gap between purchases and usage, that gap is shrinkage.
For ordering discipline, pick one fixed day a week to place orders and buy in smaller quantities until you have three or four months of real usage data. Guessing at volume before you have that baseline is how overstocking starts.
- Post a laminated par-level sheet at the backbar station
- Require a signed usage log for any bulk product pulled from storage
- Reorder on the same day every week, no exceptions
- Photograph shelves weekly to spot-check against your counts
Pro Tip: Build a 30/60/90-day plan: days 1 through 30, just count everything and set par levels. Days 31 through 60, implement FIFO and portion guides. Days 61 through 90, review your first turnover calculation and adjust order quantities based on real numbers, not memory. Single-use waste is a quieter drag on your numbers too. Beauty industry sustainability guidance points to disposable applicators, capes, and sample sizes as common sources of both waste and unnecessary reorders.
Software That Actually Helps You Track Turnover
A spreadsheet works fine when you’re running one chair and a handful of SKUs. Once you’re managing multiple product lines, multiple stylists, or a multi-chair space, manual counts start eating hours you don’t have.
Look for these features when evaluating any inventory tool:
- Barcode scanning for fast physical counts
- Automated low-stock and reorder alerts tied to your par levels
- Integration with your POS and accounting software so COGS updates without manual entry
- Usage analytics that separate retail sales from backbar consumption automatically
- Mobile counting so you’re not stuck at a desktop for inventory day
Connected systems that link POS, inventory, and analytics measurably reduce stockouts and free up staff time compared to manual tracking, and that pattern holds whether you’re running a big-box retailer or a single suite. The gap between spreadsheet and software usually isn’t accuracy. It’s the hours you get back.
If you’re testing a new tool, start by seeing how fast you can complete one physical count, then check whether the turnover and days-on-hand reports come out automatically or if you’re still doing math by hand.
How Often to Check Your Numbers
Weekly spot checks catch fast-moving problems like a color line running low mid-week. Monthly full counts give you a clean turnover calculation you can trust. Quarterly deep audits catch the slow leaks, shrinkage, expired product, and usage drift, that weekly checks miss.
Track these alongside your turnover rate:
- Days of inventory on hand (365 ÷ turnover rate)
- Product cost as a percentage of revenue, watching for drift above the typical 8 to 12% range
- Shrinkage rate, flagging anything above roughly 1% of inventory value
- GMROI (gross margin return on inventory investment) for retail specifically
Set a simple alert for yourself: if turnover drops two months in a row, or shrinkage climbs past 1%, stop and investigate before the next ordering cycle.
Mistakes That Distort Your Turnover Number
The most common measurement error is blending retail and backbar into one COGS figure. It hides which side of the business actually has a problem. A close second is switching inventory valuation methods midyear, which makes month-over-month comparisons meaningless.
Watch for these red flags:
- A sudden turnover spike often means a stockout, not efficiency
- A sudden drop usually means overordering or a slow sales month
- Repeated expiry losses point to poor FIFO discipline
- Consistent stockouts on your top sellers mean your par levels are set too low
Fix each one at the source: separate your ledgers, lock in one valuation method, retrain on FIFO, and raise par levels on anything that stocks out more than once a quarter.
A Real Turnover Turnaround
An independent colorist renting a single suite noticed her retail shelf products kept expiring before they sold, and cash always felt tight despite steady bookings. She started monthly physical counts, set par levels on her top ten retail SKUs, and switched backbar color to a measured pour system.
Within three months, her retail turnover moved from roughly 2.5 times a year to just over 4, and backbar color waste, tracked by comparing purchase volume to service counts, dropped noticeably once portioning became consistent.
The biggest shift wasn’t buying less product. It was finally knowing which fourteen products actually paid the rent, and reordering only those on a fixed schedule instead of restocking everything out of habit.
Steps she followed, in order:
- Counted every SKU by hand for one full month before changing anything
- Set minimum and maximum par levels based on that first count
- Introduced a measured-pour chart at her backbar station
- Recalculated turnover after 90 days and adjusted order quantities
A Practitioner’s Note on Realistic Expectations
Turnover math looks clean on paper, but running a suite means balancing cash flow against the risk of running out of a client’s favorite product mid-appointment. Nobody nails the ideal ratio in month one. The owners who improve fastest are the ones who count consistently and adjust in small increments, not the ones chasing a perfect number from day one. Small, repeated corrections compound into real cash saved by month six.
Let a Dashboard Do the Counting for You
Everything in this guide, the counts, the COGS math, the par-level tracking, is real work on top of an already full booking schedule. A platform that pulls directly from your POS and QuickBooks turns weekly spot checks and monthly counts into numbers that update themselves, so you spend your time reading the dashboard instead of building it.

Lumaripro connects to the systems you’re likely already using and surfaces your turnover rate, days on hand, and product cost percentage without a spreadsheet in sight. That’s the difference for an independent beauty professional running the business solo: the 30/60/90-day plan in this guide compresses when the counting and reordering alerts happen automatically instead of on your own memory. Lumaripro was built specifically for suite renters and solopreneurs who don’t have a back-office team doing this math for them. If tracking retail and backbar separately has felt like a second job, take a look at how the platform handles inventory and financial dashboards and see what your own numbers look like once they’re automated.
Sources
- Effective inventory management tips for salons | Professional Beauty Association
- Publication 538 (Accounting Periods and Methods) | IRS
Recommended