The typical U.S. salon nets between 8% and 17% profit, and most salons cluster near the 8% floor while top-quartile operators consistently clear 17% or better. The gap between those two numbers is not luck or location. It comes down to four controllable levers: average ticket, payroll structure, product-cost discipline, and fixed-cost management. Your immediate action this week is to calculate your actual net profit margin using the formula below, with owner pay counted as a real expense on your P&L. If you skip that step, every percentage you calculate is fiction.
- Benchmark range: 8%–17% net profit margin for U.S. salons
- Top-quartile target: 17%+ net margin
- Immediate action: Pull last month’s revenue, subtract every expense including a market-rate owner salary, divide by revenue, multiply by 100
- Single metric to check now: Labor as a percentage of revenue. If it exceeds 55%, that is your first problem to solve
Pro Tip: Before you read further, open your accounting software and pull your last 30-day P&L. The benchmarks below will mean far more when you can compare them to a real number.
Key Takeaways
U.S.
| Point | Details |
|---|---|
| Calculate true net margin first | Include a market-rate owner salary as an expense; the number without it is not your real margin. |
| Labor % is the primary lever | Keep wages and commissions below 50% of revenue; above 55%, margin recovery is very difficult. |
| Retail is your highest-margin line | A 10%–15% retail-to-service ratio at 40%–50% gross margin lifts overall profitability faster than most service changes. |
| Price reviews must be annual | A 10% price increase on $300K revenue adds significantly to the top line with near-zero additional cost. |
| Lumaripro automates the tracking | Real-time dashboards, POS and QuickBooks integrations, and coaching modules make the playbook repeatable without manual work. |
Table of Contents
- What does salon profit margin actually mean?
- How do profit margins compare across salon business models?
- What does a healthy salon expense breakdown look like?
- Which operational KPIs actually move your margin?
- How do you calculate your salon’s gross and net profit margin?
- Prioritized tactics to raise your salon’s profit margin
- What should you track monthly, and which tools help?
- How long do margin improvements realistically take?
- How do taxes affect your net profit margin?
- Real-world examples of salons improving their margins
- Common mistakes that quietly kill salon profitability
- The margin number that changed how I run my business
- Lumaripro makes the margin playbook repeatable
- Sources
What does salon profit margin actually mean?
Two numbers matter here, and confusing them is one of the most common financial mistakes salon owners make.
Gross profit margin measures how much revenue remains after you subtract your cost of goods sold (COGS). In a salon, COGS means the products you use to deliver services (color, chemicals, back-bar supplies) plus any retail inventory sold. It does not include labor.
Service gross margins typically run 50%–60% after COGS, which sounds healthy until you subtract payroll, rent, utilities, and everything else.
Net profit margin is what remains after every single expense, including a market-rate salary for the owner. That last part is critical. If you own the salon and also work behind the chair, your labor has a replacement cost. The Bureau of Labor Statistics publishes median wages for hairstylists and cosmetologists, which gives you a defensible number to put on your P&L as owner compensation.
Short glossary:
- Revenue: Total money collected from services and retail sales
- COGS / back bar: Direct product costs consumed delivering services
- Payroll: W-2 wages and employer taxes for employees
- Commissions: Percentage of service revenue paid to stylists
- Fixed costs: Rent, insurance, software subscriptions, utilities
- EBIT: Earnings before interest and taxes (operating profit)
- SDE: Seller’s discretionary earnings (EBIT plus owner compensation, used in business valuation)
One tax note: owner compensation paid as a salary reduces taxable business income. Profit distributions above that salary are taxed differently depending on your entity structure (S-corp, LLC, sole proprietor). A CPA familiar with service businesses should set that structure up correctly.
How do profit margins compare across salon business models?
Not all salon models carry the same margin potential. The structure of your business determines who absorbs labor risk, how rent is allocated, and how much of each revenue dollar the owner captures.
| Business Model | Typical Net Margin | What “Good” Looks Like |
|---|---|---|
| Commission salon | 5%–12% | 15%+ is strong; requires tight labor controls |
| Booth rental salon | 12%–20% | 20%+ achievable; owner earns rent regardless of stylist output |
| Hybrid (commission + booth) | 8%–15% | Depends heavily on the commission-to-rental ratio |
| Suite / studio (solo operator) | 20%–30% | 30%+ realistic; all revenue stays with the owner |
| Multi-chair commission (10+ chairs) | 6%–10% | Scale adds complexity; margin often compresses without systems |
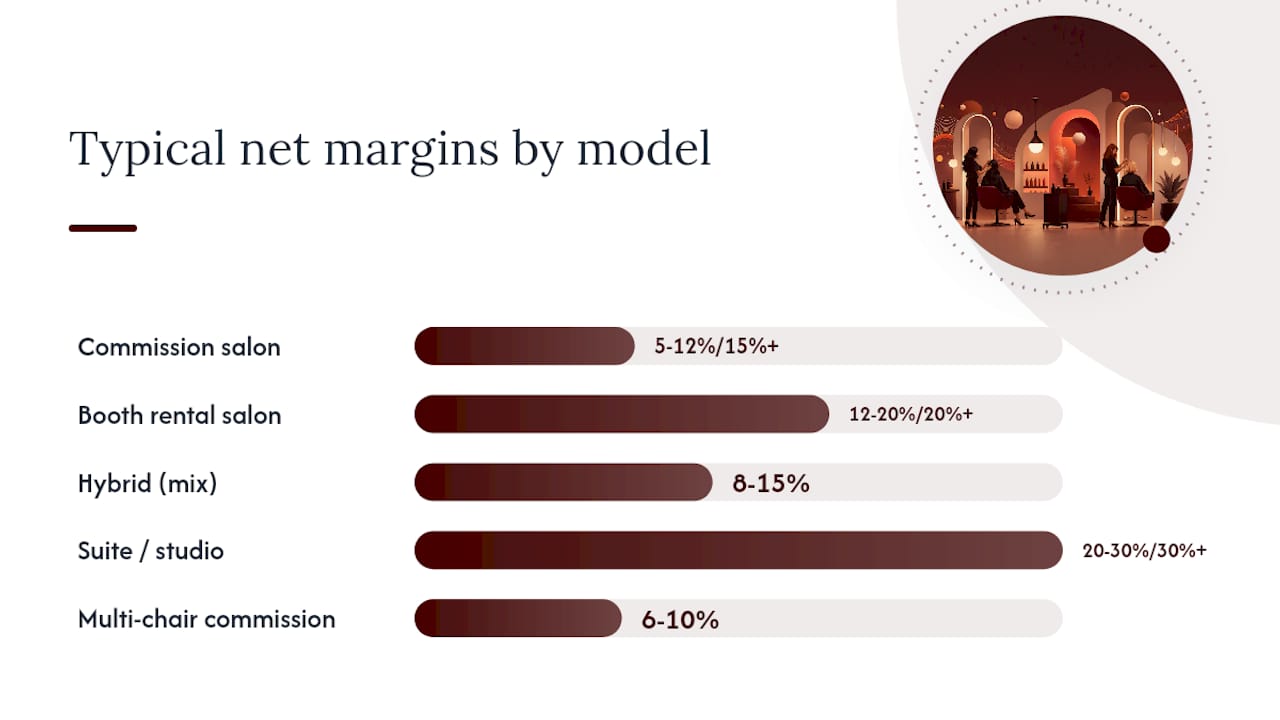
Industry surveys and IBISWorld reporting place the average near 8%, which reflects the commission model’s dominance in the market. Booth rental and suite operators tend to outperform that average because they shift labor risk to the renter. The owner’s income becomes more predictable, and fixed-cost absorption improves when chairs are consistently occupied.
Solo suite operators have the highest ceiling but also the highest personal-output dependency. If you are the only producer, your margin looks great until you take a week off. That is why salon valuation guidance consistently discounts owner-as-senior-stylist businesses unless transition work has been documented over 12–24 months.
- Retail programs that generate 10%–15% of total revenue
- Tiered commission structures that reward productivity without inflating payroll
- Rent at or below 10% of revenue
- Average ticket 20%–30% above your market’s median
What does a healthy salon expense breakdown look like?
Understanding where your revenue goes is the fastest way to find margin. Here are typical percentage ranges by expense category, drawn from aggregated industry P&L data:
| Expense Category | Healthy Range (% of Revenue) | Tipping Point |
|---|---|---|
| Wages and commissions | 35%–45% | Above 55%: margin collapses |
| Rent and occupancy | 6%–10% | Above 12%: fixed-cost drag becomes severe |
| Products and back bar | 5%–10% | Above 12%: product theft or waste likely |
| Utilities | 1%–3% | Above 4%: audit usage and contracts |
| Marketing | 1%–4% | Below 1%: growth will stall |
| Insurance | 1%–2% | Varies by state and coverage level |
| Software and merchant fees | 2%–4% | Above 5%: renegotiate or consolidate |
Quick cost-control levers by category:
- Labor: Audit commission tiers against actual stylist productivity. A stylist generating $60K in annual revenue on a 50% commission costs you $30K before any employer taxes. Tiered commissions (lower rate on lower revenue, higher rate as they grow) align incentives without inflating your base payroll.
- Rent: Negotiate lease renewals 6–12 months early. If you are in a high-traffic urban location, a percentage-of-revenue rent clause can protect you in slow months.
- Products: Run a monthly back-bar reconciliation. Compare product purchased to product theoretically consumed based on services performed. A gap of more than 5%–8% usually points to waste, over-application, or theft.
- Software and fees: Audit every subscription annually. Auto-renewing tools you no longer use are a silent margin drain that daily close-out tracking catches quickly.
Which operational KPIs actually move your margin?
Revenue and expenses tell you what happened. KPIs tell you why, and they give you something to act on before the month closes.
Utilization improves fixed-cost absorption directly: the same rent and utilities get spread across more revenue.
Revenue per stylist (target: $60K–$120K annually): A stylist generating below $60K annually is either underbooked, underpriced, or both. Above $120K, you may have a capacity constraint worth solving with an assistant or extended hours.
Average ticket (target: varies by market and service mix): This is the highest-leverage number in your business. Additional dollars on a ticket largely flow to the bottom line when labor and product costs do not increase proportionally. A $10 increase on 1,000 annual appointments is $10,000 in near-pure margin.
Retail-to-service ratio (target: 10%–15%): Retail typically carries 40%–50% gross margin, far above service margins. That ratio is one of the fastest ways to lift overall margin without adding a single appointment.

Deposit policies and card-on-file requirements cut that number substantially and tend to pay for themselves within 60 days of implementation.
Measurement cadence: Track chair utilization and no-show rate daily. Review revenue per stylist and average ticket weekly. Analyze retail-to-service ratio and full P&L monthly.
How do you calculate your salon’s gross and net profit margin?
Here is a reproducible four-step process you can run in under 30 minutes.
- Pull total revenue from your POS or accounting software for the period (month or year). Include service revenue and retail sales separately.
- Subtract COGS (back-bar product costs and retail cost of goods). This gives you gross profit.
- List every operating expense: payroll, commissions, rent, utilities, insurance, marketing, software, merchant fees, and a market-rate owner salary based on BLS wage data for your role.
- Subtract total expenses from gross profit. Divide by revenue. Multiply by 100. That is your net profit margin.
Worked example: $300,000 annual revenue salon
Common bookkeeping mistakes that skew this number:
- Owner draws recorded as distributions rather than salary (inflates apparent profit)
- Equipment purchases expensed in full rather than depreciated (deflates profit in the purchase year)
- Personal expenses run through the business (distorts every category)
- Unrecorded cash tips that affect reported revenue and payroll calculations
Prioritized tactics to raise your salon’s profit margin
Practitioner case studies show combined margin gains of 6–11 percentage points when the four levers (ticket, payroll structure, product-cost discipline, fixed-cost audit) are applied together. Here is how to sequence them.
-
Annual price review (impact: 2–4 percentage points, time to impact: 30 days). Most salons underprice by 10%–15% relative to their market. Pull your last price increase date. If it was more than 18 months ago, you have already absorbed inflation without compensation. A 10% price increase on $300K revenue adds $30K to the top line with near-zero additional cost.
-
Tiered commission restructure (impact: 1–3 percentage points, time to impact: 60–90 days). Replace flat commission rates with a tiered structure: lower rate on revenue below a threshold, higher rate above it. This rewards high producers without inflating payroll on lower-output months.
-
Deposit and no-show policy (impact: 1–2 percentage points, time to impact: 30–60 days). Require a deposit or card-on-file for all new clients and any appointment over $100. Communicate the policy clearly at booking. Most clients accept it without friction.
-
Retail attach sprint (impact: 1–3 percentage points, time to impact: 60–90 days). Run a 6-week retail training program with your staff. Set a team retail-to-service target of 10%. Tie a small bonus to hitting it. Visible product placement and a stylist recommendation script are the two highest-impact tools.
-
Product and back-bar audit (impact: 0.5–1.5 percentage points, time to impact: 30 days). Reconcile product purchased against services performed. Standardize application protocols. Switch to professional-size formats where possible to reduce per-service cost.
-
Fixed-cost audit (impact: 0.5–2 percentage points, time to impact: 30–60 days). List every recurring subscription and contract. Cancel anything unused. Renegotiate merchant processing rates (even a 0.3% reduction on $300K in card volume saves $900 annually).
Pro Tip: Raising average ticket is the single highest-leverage move because those extra dollars largely flow straight to net profit. A $15 ticket increase across 800 annual appointments adds $12,000 in near-pure margin on a $300K revenue base.
What should you track monthly, and which tools help?
A monthly dashboard does not need to be complicated. These six numbers tell you almost everything:
- Total revenue vs. prior month and prior year: Trend matters more than any single month
- Gross margin %: Flags COGS creep before it compounds
- Labor % of revenue: Your single most important expense ratio
- Retail-to-service %: Tracks your highest-margin revenue line
- No-show rate: Quantifies booking waste
- Daily EBIT estimate: Revenue minus pro-rated fixed costs for the day
Owners who run a five-minute daily close develop faster course-correction ability than those who only review monthly P&Ls. Daily signals catch creeping subscriptions, auto-renew cost increases, and slow booking weeks before they become slow months.
Tool categories and what they supply:
| Tool Category | What It Gives You | Integration Priority |
|---|---|---|
| POS (e.g., Square, Vagaro, Meevo) | Daily revenue, ticket averages, retail sales, appointment data | First priority |
| Accounting (e.g., QuickBooks) | Full P&L, expense categorization, cash flow | Second priority |
| Payroll (e.g., Gusto, ADP) | Labor %, employer tax costs, per-stylist earnings | Connects to accounting |
| Booking software | Utilization rate, no-show tracking, rebook rate | Feeds POS |
| Dashboard / analytics | Consolidated KPI view across all systems | Final layer |
The integration sequence matters: POS data flows into accounting, which produces your P&L. Payroll connects to accounting for accurate labor costs. A dashboard layer pulls from all three to give you the daily close-out number without manual entry.
FRED’s personal care and service receipts data is also worth bookmarking. It gives you macro-level context for whether a slow month is your problem or an industry-wide pattern, which changes how you respond.
How long do margin improvements realistically take?
Expectations matter here. Owners who expect a price increase to fix everything in 30 days get discouraged when the full impact takes a quarter to show up in the P&L.
- 30 days: Deposit policy live, price increase announced, fixed-cost audit complete. Expect to see no-show rate drop and a small revenue-per-appointment uptick.
- 90 days: Tiered commission structure in place, retail training complete, back-bar reconciliation running monthly. Labor % should begin declining if the commission restructure is working.
- 180 days: Retail-to-service ratio should be measurably higher. Average ticket reflects the price increase. Combined, these two moves on a $300K salon can add $15,000–$25,000 in annual net profit.
- 365 days: Full four-lever framework embedded. A salon at 8% net margin that executes all four levers consistently can realistically reach 12%–15% within 12 months, with top-quartile operators hitting 17%+.
Seasonality and external shocks: FRED revenue series show that personal care service receipts follow predictable seasonal patterns, with January and February typically the softest months in most U.S. markets. Build a cash reserve equal to 6–8 weeks of fixed costs to absorb slow periods without cutting staff or marketing. Wage increases in your market (tracked via BLS data) are the most common external shock to labor %, and they require a price review response within 60–90 days to protect margin.
How do taxes affect your net profit margin?
Tax structure has a direct and often underestimated impact on what you actually keep. A few considerations specific to salon owners:
An S-corp election allows an owner to split income between a reasonable salary and distributions, reducing self-employment tax on the distribution portion. For a salon netting $80,000 annually, the tax savings from an S-corp election can be meaningful, though setup and payroll administration costs must be weighed against the benefit. A CPA should run the numbers for your specific situation.
Owner compensation on the P&L: As noted in the formulas section, paying yourself a market-rate salary through payroll (rather than draws) gives you a more accurate picture of true business profitability and reduces taxable business income. It also makes your financials more credible to lenders and buyers.
Depreciation vs. expensing: Equipment purchases (chairs, dryers, color processors) can often be fully expensed in the year of purchase under Section 179 of the tax code, which reduces taxable income immediately. Alternatively, depreciating them over several years smooths the expense impact. The right choice depends on your current-year income and projected future income. Neither approach changes cash flow, but both affect reported net margin.
Sales tax on retail: Most states require you to collect and remit sales tax on retail product sales. Failing to account for this correctly inflates apparent revenue and creates a liability. Your POS should handle collection automatically, but reconciliation with your state’s filing requirements is your responsibility.
This section covers general information only. Consult a licensed CPA or tax professional for advice specific to your business and state.
Real-world examples of salons improving their margins
These scenarios illustrate how the four-lever framework plays out in practice. They are composite examples drawn from documented industry patterns, not individual named businesses.
Scenario 2: Solo suite operator optimizes retail
Scenario 3: Booth rental salon reduces no-shows
The recovered revenue went almost entirely to net profit.
Common mistakes that quietly kill salon profitability
Most margin problems are not dramatic. They are slow leaks that compound over months.
Underpricing and price avoidance: The most common. Owners fear client pushback and delay price increases until inflation has already eroded margin. Annual price reviews tied to your local cost-of-living index remove the emotional weight from the decision.
Treating owner draws as profit: If you pull $60,000 from the business as draws and report $70,000 in net profit, your real margin is much lower than it appears. The business must be able to pay a replacement for your labor and still show profit. That is the only number that matters for long-term sustainability and eventual sale value.
Ignoring retail: A salon with zero retail program is leaving its highest-margin revenue line completely empty.
Tiered structures reward growth without inflating your payroll on lower-output months.
No daily close-out discipline: Owners who only review financials monthly are always reacting. A five-minute daily close (today’s revenue minus pro-rated fixed costs) catches problems in days, not weeks.
Booking gaps treated as downtime: Every empty slot is a fixed-cost absorption failure. A chair sitting idle for two hours still costs you rent, utilities, and insurance. Rebooking scripts, waitlists, and last-minute booking promotions convert idle time into revenue.
The margin number that changed how I run my business
Most salon owners I talk to know their revenue. Almost none of them know their true net margin, the one that counts owner pay as a real expense. When I first ran that calculation properly, the number was humbling. The business looked profitable on paper until I added a market-rate salary for my own chair work.
That recalculation forced a different set of decisions. The price increase I had been postponing for 18 months became non-negotiable. The flat commission structure I had kept to avoid difficult conversations with staff got replaced with a tiered model within 90 days. The retail program I had treated as an afterthought became a tracked KPI with a weekly team review.
The discipline that made the biggest difference was not any single tactic. It was the daily close-out. Five minutes at the end of each day, comparing actual revenue to the pro-rated fixed-cost target. That habit surfaces problems fast, before they compound into a bad quarter.
One thing I would tell any owner starting this process: do not wait until you have perfect data. Run the calculation with what you have today. An imperfect number you can act on beats a perfect number you are still waiting to calculate.
Lumaripro makes the margin playbook repeatable
Knowing the playbook is one thing. Running it consistently while managing a full client book is another problem entirely.

Lumaripro is built specifically for suite renters and independent beauty professionals who need real financial clarity without hiring a bookkeeper or a business coach separately. The platform connects to your POS and QuickBooks to generate a real-time financial dashboard, so your labor %, retail ratio, and daily EBIT are visible without manual calculation. Pricing templates, retail training modules, and rebooking coaching are built into the platform, so the tactics in this article are not just theory. They are guided workflows you can execute this week.
See how Lumaripro supports salon owners with dashboards, coaching, and integrations, or explore the full platform to see how it maps to the four-lever framework. The playbook works with disciplined accounting and any good set of tools. Lumaripro cuts the manual work and speeds up the implementation.
Sources
- Salon profitability data
- Bureau of Labor Statistics — Barbers, Hairstylists, and Cosmetologists
- FRED — Personal care and service receipts
- Hair Salon Profit Margin 2026: Why Top Owners Hit 17% While Most Stay at 8%
- Hair Salon Valuation Calculator & Real 2026 Multiples
This article is general information, not a substitute for advice from a qualified financial advisor. Consult a qualified financial professional about your own circumstances before acting on anything here.
Recommended